Bitcoin Extends Decline into Key $94K-$96K Demand Zone Following Trendline Rejection
Bitcoin has continued its downward movement, now settling within the $94,000 to $96,000 macro demand region after a failed retest of the previously broken trendline. The market currently sits at a critical decision point, where the next reaction in this zone will determine whether Bitcoin embarks on a larger accumulation phase or slips into a further correction.
**Technical Analysis by Shayan**
### Daily Chart Overview
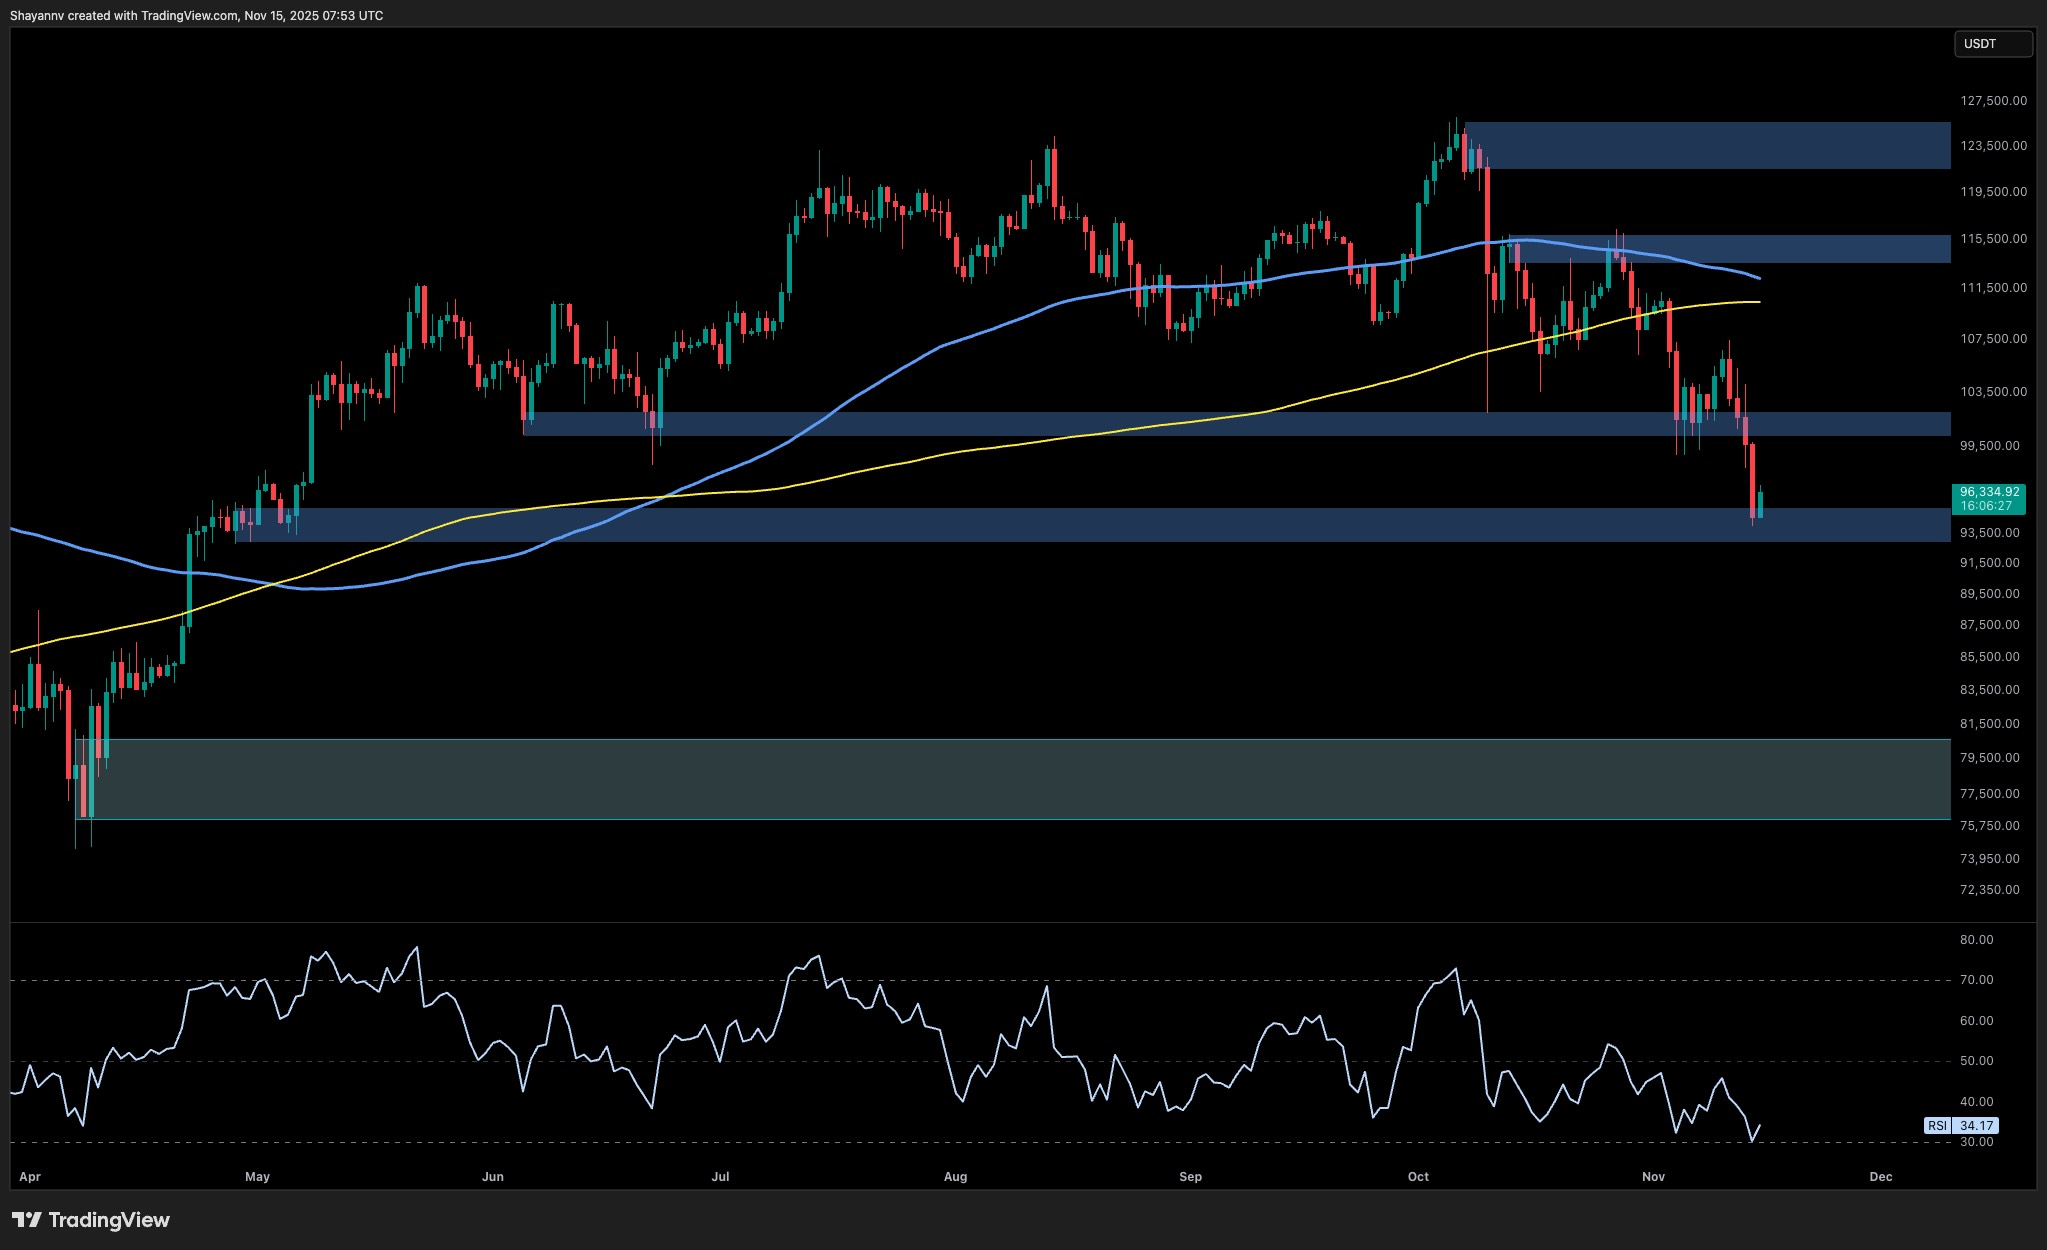
On the daily timeframe, Bitcoin remains below both its 100-day and 200-day moving averages, which now act as layered resistance levels above the price. The rejection from the 100-day moving average near $110,000 accelerated the recent decline, ultimately resulting in a clean sweep of the $99,000 to $100,000 liquidity cluster.
This movement coincides with a strong displacement candle seen earlier this week, signaling clear seller dominance as the market transitioned into the lower portion of its multi-month distribution range.
Currently, Bitcoin is testing the $94,000 to $96,000 demand block—a significant region that aligns with high-volume trading activity from earlier this year when long-term participants accumulated heavily. Should the price stabilize here and form a higher low, this zone might once again serve as a structural base.
However, if the market fails to defend this area, the next major support lies deeper around the $80,000 to $82,000 macro range, which marks the bottom boundary of the larger cycle structure.
### 4-Hour Chart Insights
On the 4-hour chart, the structure illustrates a full bearish sequence following the breakdown of a rising wedge pattern. After the breakdown, Bitcoin retested the underside of the trendline at around $106,000 to $108,000 but faced a clean rejection.
This rejection confirmed the shift from support to resistance, decisively pushing the short-term price flow downward. The ensuing selloff drove Bitcoin directly into the $94,000 to $96,000 zone—a historically reactive demand area that has triggered medium-term reversals in previous cycles.
While an initial reaction has formed at this level, the structure remains heavy, and higher-timeframe signals required for confirming sustainable recovery are yet to appear.
For any meaningful short-term strength to develop, Bitcoin must first reclaim the $101,000 to $103,000 liquidity pocket, which currently serves as the nearest barrier preventing upward momentum.
### On-Chain Analysis
Analyzing on-chain data, particularly the Realized Price distribution across UTXO age bands, provides insight into current investor positioning.
Bitcoin has now dropped below the realized price levels for both the 1-3 month and 3-6 month cohorts. Since these groups are currently in aggregate loss, their realized prices effectively transform into realized supply, creating an overhead resistance band roughly between $105,000 and $110,000.
Short-term holders are likely to sell into any recovery attempts within this zone to exit at breakeven. Historically, this behavior forms the first layer of resistance following sharp downward moves.
In contrast, the 6-12 month cohort remains in profit, with their realized price located around $94,000 to $96,000—almost perfectly aligning with current market support. This group tends to be more resilient, and their realized price often functions as a stabilizing zone during deep corrections.
Previous cycles show that the market commonly interacts with this mid-term cohort’s realized price during late-stage shakeouts, allowing long-term participants to absorb supply from capitulating short-term holders.
This on-chain structure positions Bitcoin between realized supply overhead from short-term loss holders and realized demand below from mid-term holders.
A decisive break beneath this key demand zone would signal a deeper capitulation phase, likely triggering a reset in market sentiment before any attempt at initiating a new bullish trend.
—
Stay tuned for further updates as Bitcoin approaches this critical juncture in its price action.
https://cryptopotato.com/bitcoin-price-analysis-whats-next-for-btc-after-tanking-to-94k/